PROFILE+

TrackTicks Profile+

A full volume profile and a real-time bid/ask footprint — in one indicator, on a zone you control.

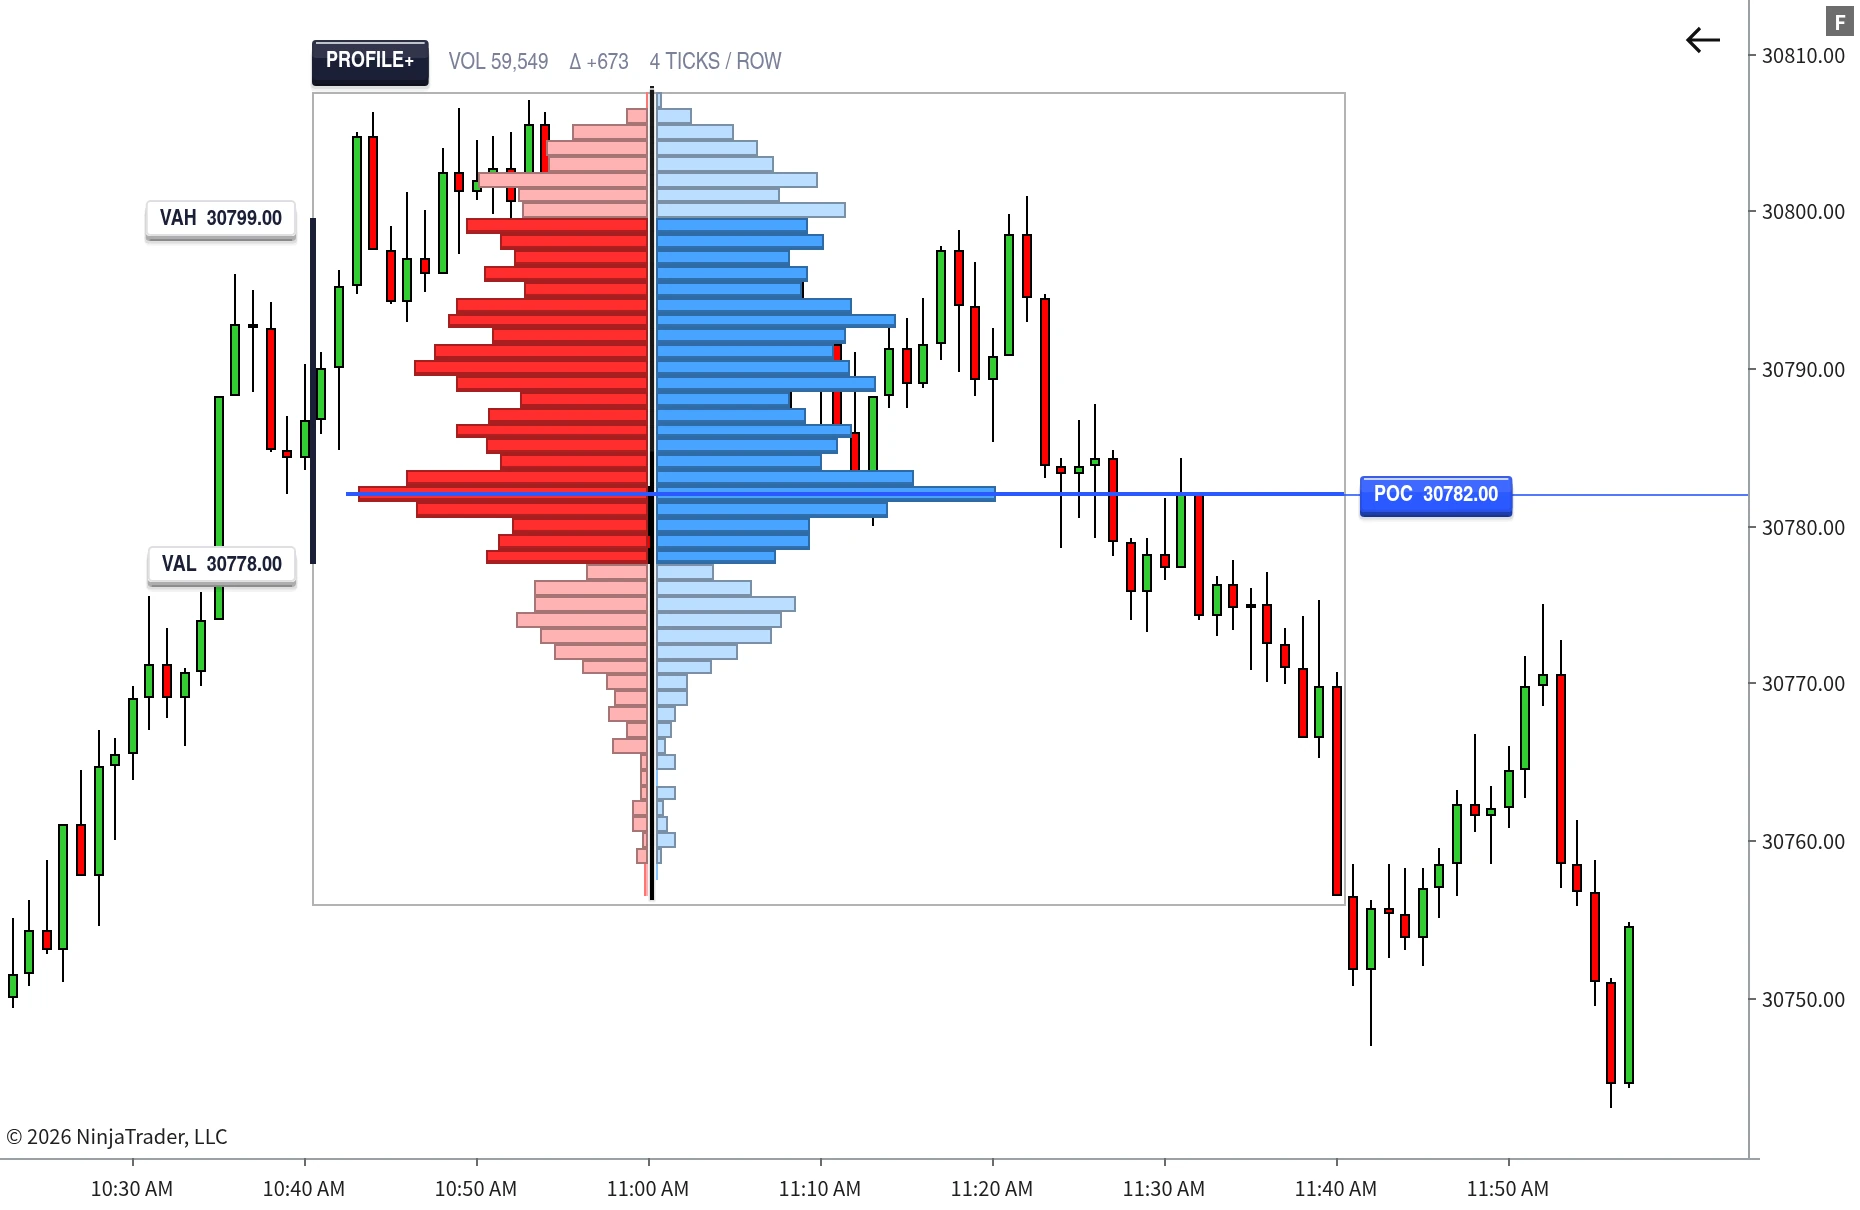
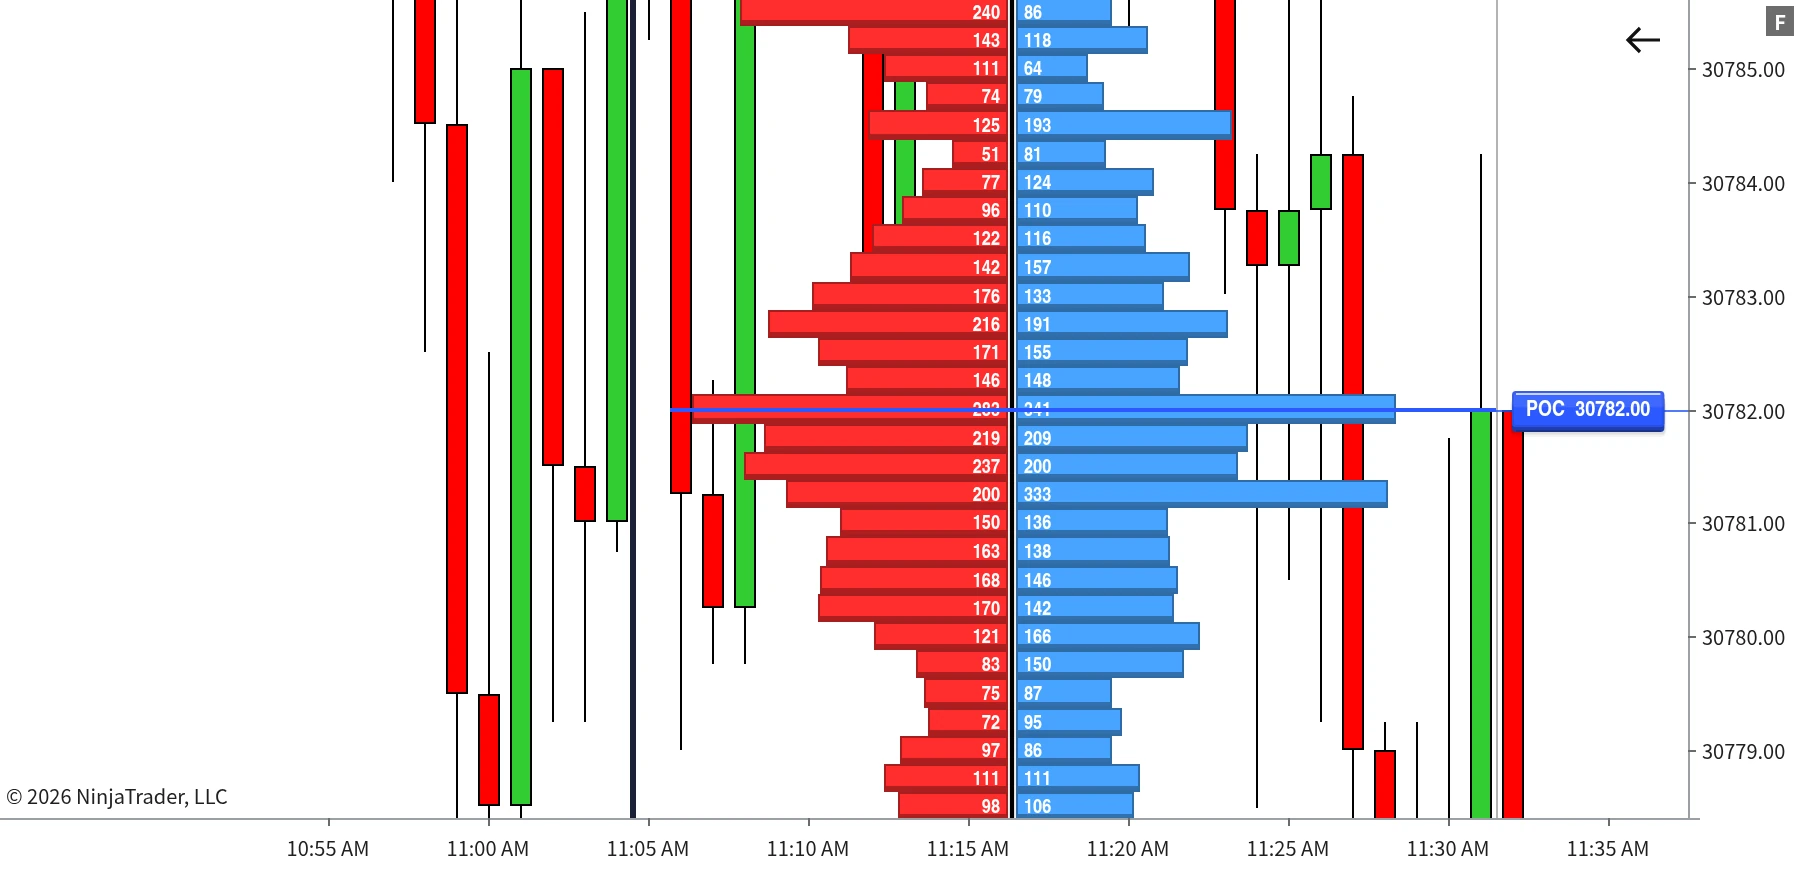
TrackTicks Profile+ bid/ask volume profile on a NinjaTrader 8 chart

Overview

TrackTicks Profile+ is a NinjaTrader 8 indicator that builds a live volume profile over any zone you draw on the chart — and unlike a standard volume profile, every price level inside it is broken down into real, tick-by-tick buy-side and sell-side data as it happens.

At its core, it's a volume profile: a horizontal read of exactly how much traded at every price level in a range, so you can see where volume actually built up and where it's thin. But it doesn't stop at total volume. Because every single trade is classified and tracked individually as it prints, the exact same profile also gives you a full bid/ask order-flow footprint, a volume heatmap, and a delta view, all from the same underlying tick data, switchable with one click — combining what's typically two separate indicators into one.

And it isn't locked to a session or a fixed bar count the way most volume profiles are. You draw the zone yourself — an opening drive, a consolidation, a breakout leg, any window you want to study — and the indicator builds the profile for exactly that range, live, updating on every print.

Every Real-Time Trade Tick, Not an Estimate

This is the part that separates TrackTicks Profile+ from a typical volume profile: while it's running live, nothing is summarized, sampled, or batched before it reaches you.

Every single trade print your NinjaTrader data feed delivers is individually classified the moment it arrives — using the standard tick rule — and added to its exact price level immediately. At its finest setting, the profile shows one row per individual tick, with nothing grouped or smoothed. You can zoom in and read the literal bid and ask volume numbers at any single price level, not just a bar's relative length.

Want the full-resolution picture, or a cleaner, merged read across a wider zone? Tick Aggregation lets you dial between the two — from raw, single-tick granularity up to broader merged levels — without ever losing accuracy, because the underlying tick data is still what's driving it either way.

How It Works

Key Features

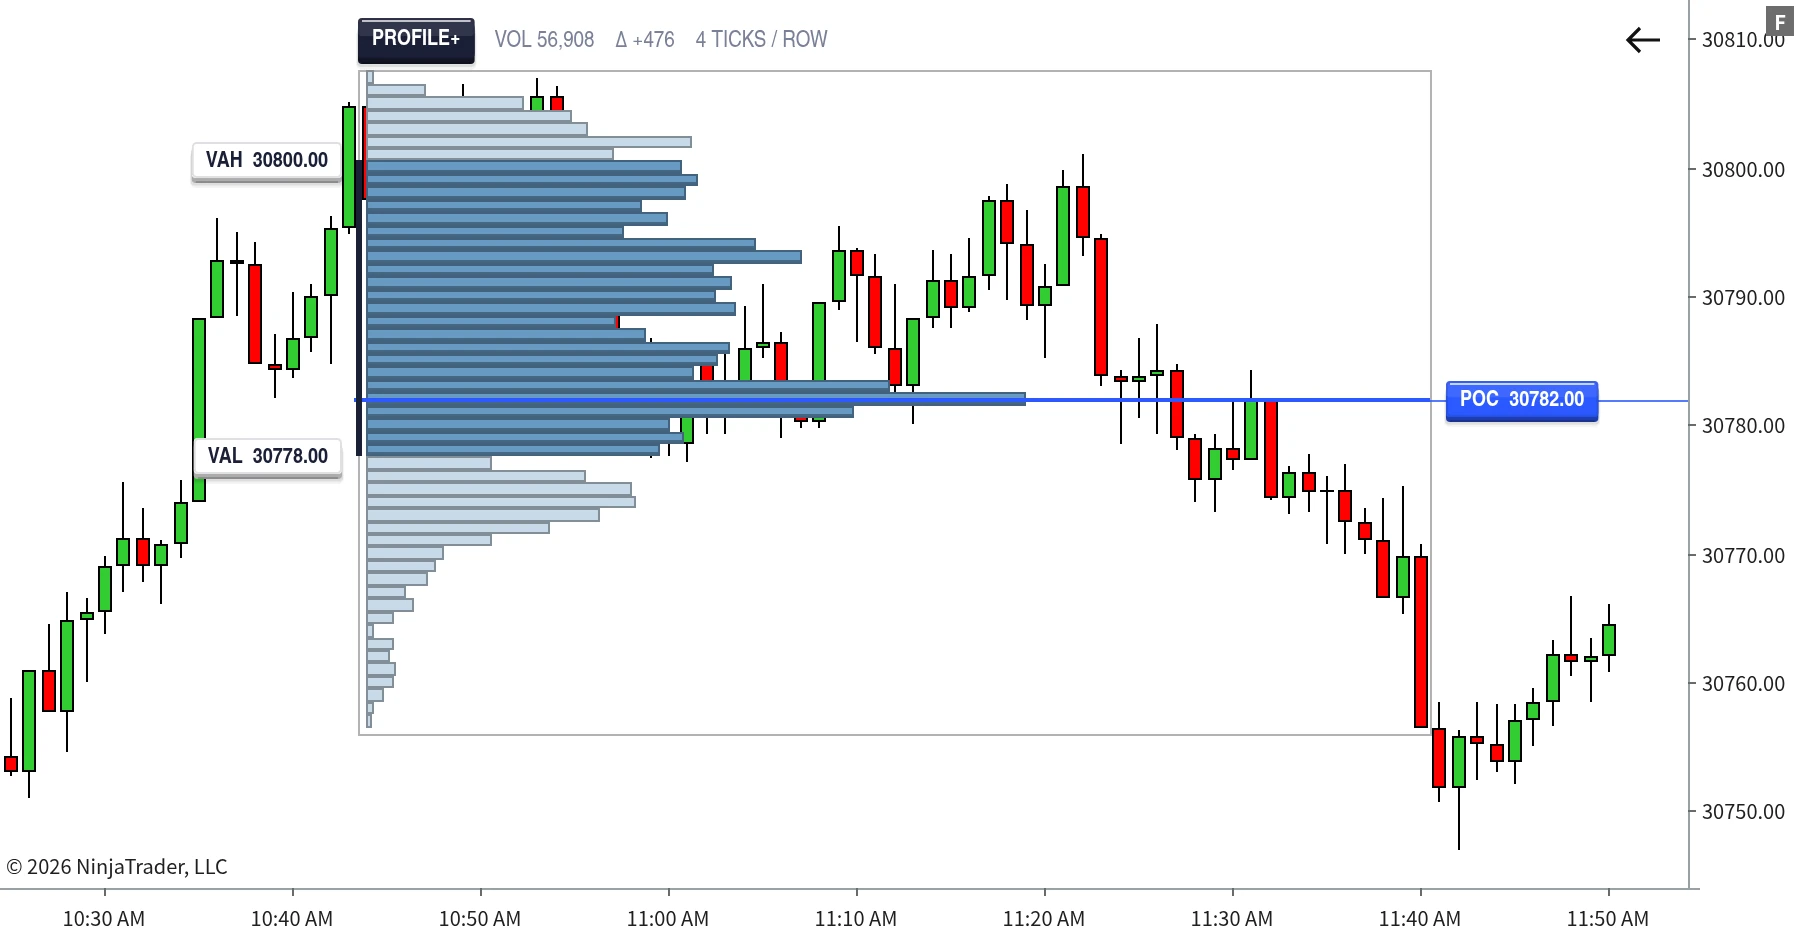
A true volume profile, front and centerPlain Volume mode gives you the classic single-sided read: one bar per price level, sized by total volume traded there — now available over any custom zone instead of only a fixed session.
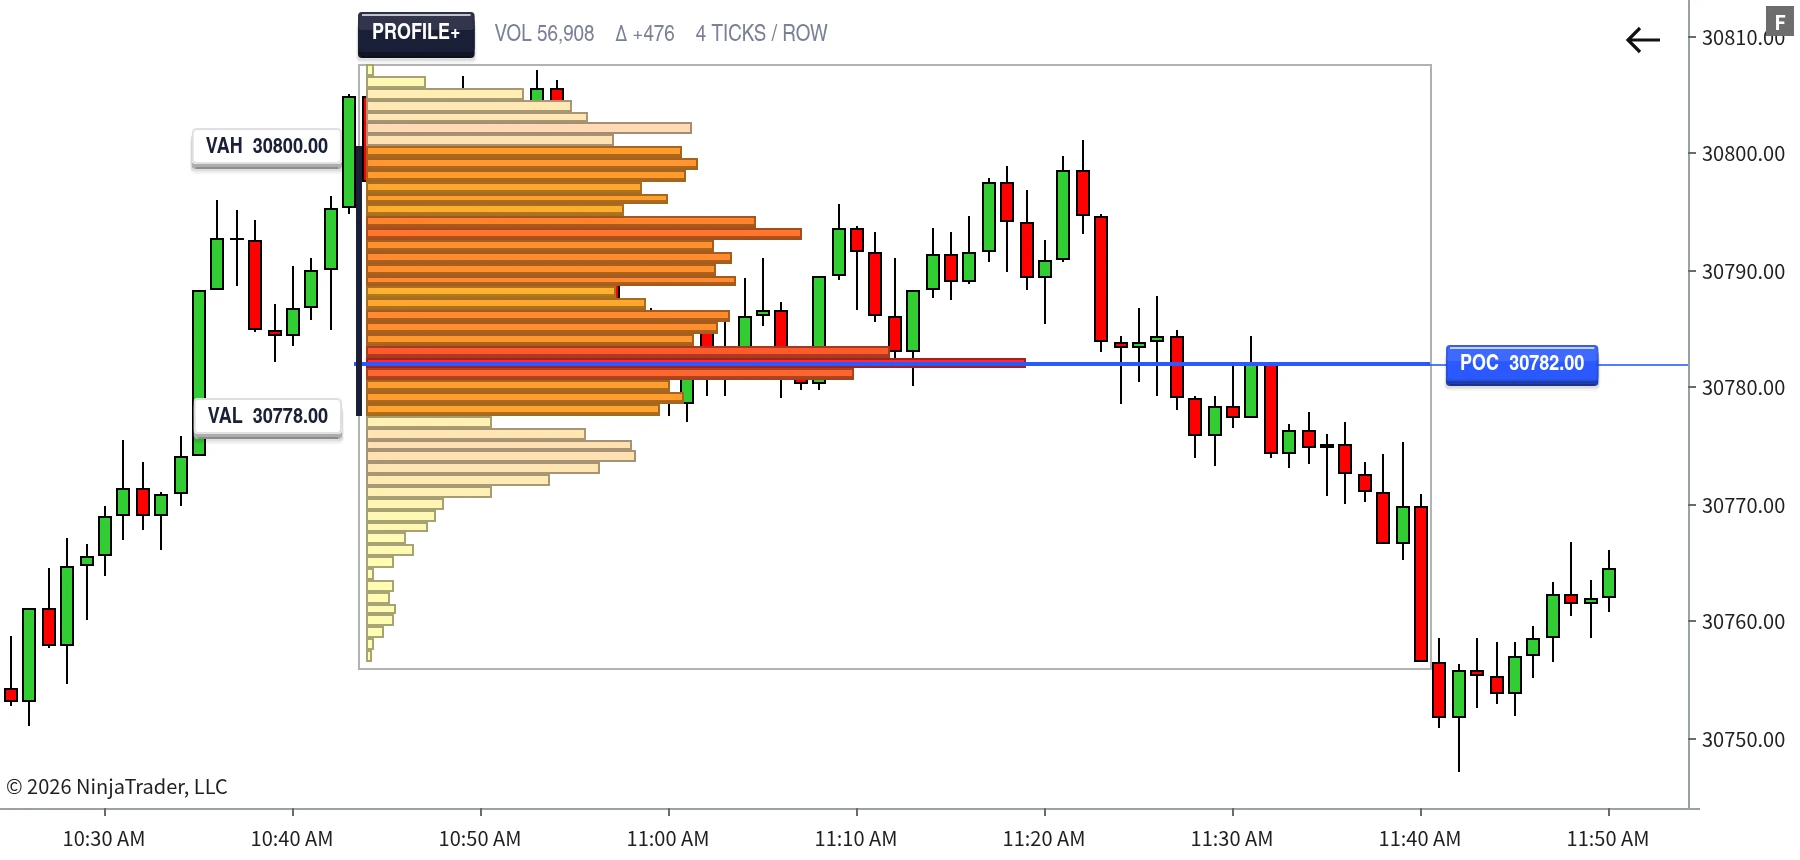
A Volume Heatmap for reading it at a glanceThe same volume-profile shape, but color intensity scales with volume too, so the highest-volume nodes visually pop without needing to read a single number.
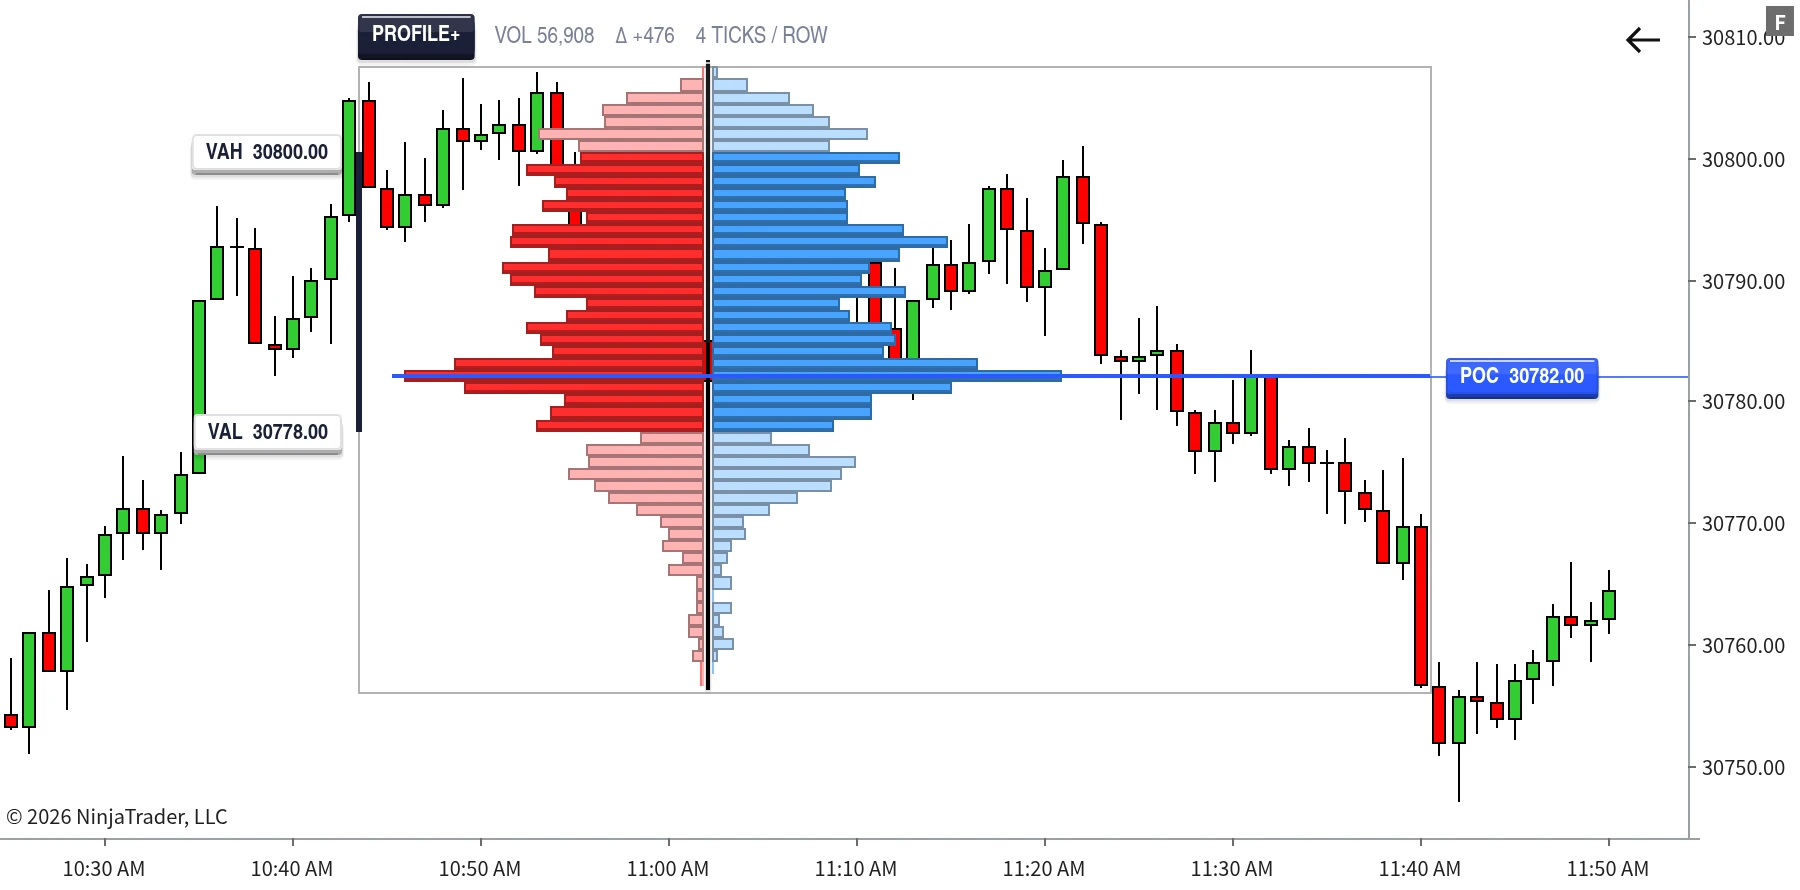
A full bid/ask footprint, from the same dataSplit Bid/Ask view puts buy-side and sell-side volume on opposite sides of a center line at every price level; Bid Only and Ask Only isolate one side when that's all you want to study.
Delta modeBars keep the same shape as the volume profile — length driven by total volume — but color by which side dominated at that level, giving you a footprint-style delta read in the same visual language as the rest of the profile.
Automatic Point of ControlThe single price level with the most combined volume in your zone is identified and highlighted automatically, updating live as volume shifts, with an extension ray marking that level as new bars form.
Built-in Value AreaCalculated using the standard market-profile method around the Point of Control, at a configurable percentage (70% by default). Everything outside the Value Area is automatically dimmed.
Tick Aggregation — control your own resolutionBy default every price tick gets its own row. Turn up Tick Aggregation and the indicator groups consecutive ticks into merged rows instead — run it at 1 for scalping a tight range, or turn it up on a wide zone spanning hundreds of points.
Screen-pinned panelKeep a second copy of the profile fixed to the left or right edge of the chart as you scroll, so it stays visible while you scroll back through price history.
Built to work automatically across futures productsEvery calculation is driven by the instrument's own tick size rather than any hardcoded assumptions — equity index futures, energies, metals, currencies, and fractional-tick interest rate products are all handled correctly.

See It On a Chart

Built For

Traders who want a genuine volume profile and real order-flow detail in the same tool — identifying where real size has traded, where price has been accepted or rejected, and where the balance between aggressive buyers and sellers has shifted — on any futures market, over any custom zone, at any level of granularity from a single tick on up.

Requirements

Runs on NinjaTrader 8. Full tick-by-tick bid/ask accuracy requires a live data feed with Level 1 (bid/ask) data while the indicator is running and connected, with Tick Replay enabled on the chart's data series. Historical bars — those that printed before the indicator was attached and running — use an estimated split, since true historical bid/ask data isn't available from NinjaTrader's feed. If your feed or instrument doesn't provide Level 1 bid/ask, trades still process tick by tick using a midpoint-based classification in place of a true bid/ask comparison.

Full Walkthrough Video

Every setting explained, plus real chart examples of TrackTicks Profile+ in use.

Disclaimer

TrackTicks Profile+ is a charting and data-visualization tool. It does not generate buy or sell signals, does not predict future price movement, and is not a substitute for your own analysis, judgment, or risk management. Accuracy of the real-time bid/ask classification depends entirely on the completeness and timeliness of the data supplied by your NinjaTrader connection, data feed, and broker. Historical bars are shown using an estimated split rather than verified historical order-flow data.

Trading futures carries a substantial risk of loss and is not suitable for everyone. See the full site disclaimer for complete terms.


TrackTicks Support Usually replies within 24 hours
Have a question about setup, billing, or an indicator? Send us an email and we'll get back to you.
Email Us support@trackticksindicators.com